Women Architects and World Fairs

Category: ARTH 851 Fall 2026 (Page 4 of 7)

Mapping the Relationship Between Art and Place

Spatial mapping is an old but still useful and relevant tool in art history. This week, after reading about and looking through different art historical mapping projects, we had the chance to experiment with some accessible digital mapping tools ourselves, including Google Maps and JS Story Maps. With advances in technology, digital mapping is an accessible and educationally rewarding tool in the field of art history.

            In Béatrice Joyeux-Prunel’s article “Digital Humanities for a Spatial, Global, and Social History of Art,” she explains that art historians’ interest in the spatial relations of art is not new—in fact, it dates back to the time of Giorgio Vasari.[1] The identification of art with particular places helped to define the cultural identity of countries while also advancing nationalist agendas.[2] In recent decades, spatial mapping has become an analytical tool facilitated by advancing digital technology. Joyeux-Prunel offers a tactical introduction on beginning, organizing, and executing digital mapping projects. Ultimately, Joyeux-Prunel explains that mapping in art history is useful for education and scholarly research.

Earlier in the semester, we read “The Digital Art History as the Social History of Art: Towards the Disciplinary Relevance of Digital Methods” by Paul Jaskot, who argued that digital tools for macroanalysis would become the norm for art history research in twenty-first century.[3] In this article, he used the example of a digital mapping project of a German design firm that allowed him to extract an unusual pattern in the firm’s construction habits. He used this example to illustrate his point that macroanalysis with the aid of digital tools can highlight patterns that a human may not be able to recognize by just reading.

The Jaskot and Anne Kelly Knowles article from this week, “Architecture and Maps, Databases and Archives: An Approach to Institutional History and the Built Environment in Nazi Germany,” highlight how a mapping project may help advance scholarly research.[4] Rather than the end goal being an interactive, educational digital humanities project for the public, this project served to help Jaskot and Knowles understand the construction and building habits of the Nazis running Auschwitz for a written research paper. By mapping and tracking the construction of the buildings, Jaskot and Knowles revealed a pattern of architectural instability and dynamism rather than the stable, unchanging, presence that the Nazis wanted to communicate.

While Jaskot and Knowles’ digital mapping project was not permanently available to the public, other digital mapping projects like Columbia University’s Mapping Gothic France, Boyeux-Prunel’s Artl@s Geomap of Paris salons, and the University of Iowa’s Campus Cornerstones. My personal favorite is Columbia University’s Mapping Gothic France because of its immense scope, images, and user features. Mapping Gothic France pinpoints where a multitude of Gothic cathedrals are located throughout Europe, not limited to just France. When a use selects a single cathedral, they are offered an interactive floorplan in which arrows provide images of the church from different viewpoints. The panorama is also very detailed and helpful for both the casual browser and the interested scholar. The depth of Mapping Gothic France can be attributed to the years dedicated to this project and advanced funding through a grant.

Although more limited in scope compared to Mapping Gothic France, the University of Iowa’s Campus Cornerstones offers an interactive, archival-based account of the buildings on campus throughout university history. Combining both map and timeline features, Campus Cornerstones allows users to see where old buildings used to be located and what stands in their place now. From this project, users can understand the architectural history of the University of Iowa and how it evolved over time.

I tried my own hand at basic digital mapping in throughout this week, as well. I came into class this week with some experience in both Google Maps custom maps and JS Story Maps. In Google Maps, I had identified where monumental sculptures were located in a 1974 public sculpture exhibition, Monumenta, throughout the city of Newport in Rhode Island. I had used JS Story Maps for an Italian project during my undergraduate degree to map out a theoretical road trip across Italy. In class this week, I began playing with a few maps, like a Google Map identifying places that I visited often when I studied abroad in Rome and a JS Story Map identifying a few centers of Pennsylvania German folk art. Through this experimentation, I appreciated how the intuitiveness of these interfaces. These low-stakes tests also prepared me for a project more related to a different research project that I am working on.

I decided to make a map of twenty objects in Google Maps that Owen Jones identifies in his 1856 book The Grammar of Ornament. This map does not include all the illustrations in the book, but I attempted to choose one illustration that had the clearest location from each chapter. I excluded any illustrations from his chapter on designs from nature and instead opted to select two illustrations of column capitals from the Egypt chapter. I realized soon after I began inputting the location information in the map that some location’s names had not remained the same. For example, the “Memnonium” that Jones refers to in Egypt, is now referred to as the “Ramesseum” to refer to an ancient tomb. There were also a few items from India and Persia that Jones accessed from libraries and museums in England rather than their place of origin. He also uses racist and culturally reductive language, using the term “savage” to refer to indigenous tribes across continents. Because he used this term to name a chapter, I included it in the description for that illustration, but I made a note in the map description warning any potential viewers about the presence of this racist, antiquated language.

After reading the articles about metadata last week and my own experimentation with mapping this week, I realize that there is also a healthy amount of ambiguity that scholars must contend with. I think that approaching uncertainty with transparency about unknown or ambiguous information is the best way to present information without construing data. Mapping is still a useful and relevant tool in art history to extract patterns from large amounts of data and allow users to understand a bigger picture of the relationship of art with place and time.


[1] Beatrice Joyeux-Prunel, “Digital Humanities for a Spatial, Global, and Social History of Art,” In The Routledge Companion, ed. Kathryn Brown (Routledge, 2020), 88-108.; Joyeux-Prunel, “Digital Humanities,” 88.

[2] Joyeux-Prunel, “Digital Humanities,” 89.

[3] Paul B. Jaskot, “The Digital Art History as the Social History of Art: Towards the Disciplinary Relevance of Digital Methods,” Visual Resources 35:1-2 (2019): 21-33.

[4] Paul B. Jaskot and Anne Kelly Knowles, “Architecture and Maps, Databases, and Archives; An Approach to Institutional History and the Built Environment in Nazi Germany,” The Iris (February 15, 2017).

Linking humans and data

Working on the Artist Book Critical Index (ABCI), I’ve already gotten to work with data I really enjoy: linked data, the semantic web, distributed knowledge graphs. I enjoy ontology and vocabulary creation and being part of building semantic frameworks that other organizations can then pick up and use.

Angela Dressen’s “Cultural Heritage Data for Research – An Introduction” covers semantic web work in the art history space with clear appreciation and understanding, but in the Linked Art section, it also presents the idea that with proper tools, you then don’t need data scientists in the museum space.1 The idea that if the structure’s in place and it’s easy enough to use, museums don’t need data professionals in permanent positions is part of why digital humanities projects fall short or become obsolete. When data projects are approached as short-term, quick-burst projects, they die out quickly. Not because the data isn’t good anymore or the tools are bad, but because there is no one cranking the engine to improve the data and move the project forward. If there’s one thing I’ve learned working on the ABCI, it’s that there has to be human energy for all aspects of the project, including the data handling and project maintenance.

The ABCI started as a Zotero library made by the Sloane Art Library’s now-retired manager, Josh Hockensmith, who is a book artist. He was making an index of reference works connected to artists’ books: where they were cited and on what page an image could be found. Graduate students were then assigned to the project and started expanding beyond UNC’s own collection by adding WorldCat links. It is a really unique, robust data set that could only come from human beings.

One of the key points Broman and Woo make in “Data Organization in Spreadsheets” is that the raw data should live in a different place than where it is analyzed and manipulated.2 This was one of the untidiest aspects of the original Zotero ABCI library. The workflow for photographing artist books was living in the same Zotero, and it was difficult to untangle verified entries from unverified ones, even when they were marked with workflow tags.

We also had to deal with missing data, the equivalent of what Broman and Woo talk about with leaving cells empty.3 The early ABCI entries had full metadata. But as the point became simply tracking citations between books and linking to the catalog entry at UNC or WorldCat.org, entries started having just author and title, with no standardization in capitalization, author name order, or which creators should be listed. And because the citation information had to live in Zotero’s notes field, which is a free-for-all of text, we had to figure out some constraints, along with using Claude Code, to pull the citation data out and attach it to the items it belonged to.

One of my favorite parts of the process has been creating ontologies and vocabularies. It’s modeling how the data should look in triple format, in our case Turtle, with an example, because often when you start doing an example is when you start saying, “Oh no, that data would be great to have, but we don’t have that,” or, “What do we call a construction method?” Luckily, I was able to piggyback off the work of the Book Arts Research Database4 and Opening Artists’ Books5 for reference.

Sometimes a tool becomes unexpectedly good at another job, in this case, metadata checking. One unexpected side effect of the ABCI has been pointing out where our catalog metadata was misentered or left out. More than once, the Sloane Art Librarian, Alice Whiteside, has asked me to use the tool to pull books with a particular construction method, only to find that a book is missing or mislabeled. If you are working with incorrect data to start with, you’re going to end up with incorrect data.

As for data I would like to work with in the near future, I’ve been fascinated lately by maps of crafters and craft spaces. Especially having read more of Brendan Keogh’s recent work about viewing video game developers as craftspeople, I’d like to make a network map of video game creators and the companies or specific games they’ve connected to. Art history already acknowledges that who an artist is taught by and where they have worked has a large influence on their oeuvre. This type of lineage study is not something I’ve encountered yet in game studies.

My first step for a network map of game artists/craftspeople would be to model one simple connection. I generally do not start in a spreadsheet but think with pen and paper about how the graph might flow and then start throwing it into Turtle triples. I would start with a relatively well-established indie or smaller-team game from a company where English is a primary language. From there, I would pick one creator in an art leadership role, like an art director or character designer, and work through their CV. Once I know what information I’m looking for, I’d break out the spreadsheet to gather everything about one person, translate it over, see how it works, and troubleshoot. Then I’d look to other sources of linked data I could link out to, like Wikidata. From there, whether or how to proceed to a larger scale would really depend on what the data revealed in the small model.


  1. Dressen, A., (2025) “Cultural Heritage Data for Research – An Introduction”, Open Library of Humanities 11(1). doi: https://doi.org/10.16995/olh.18710↩︎

  2. Broman, Karl W., and Kara H. Woo. 2018. “Data Organization in Spreadsheets.” The American Statistician 72 (1): 2–10. doi:10.1080/00031305.2017.1375989.↩︎

  3. Broman, Karl W., and Kara H. Woo. 2018. “Data Organization in Spreadsheets.” The American Statistician 72 (1): 2–10. doi:10.1080/00031305.2017.1375989.↩︎

  4. https://researchbookart.uicb.uiowa.edu/↩︎

  5. https://oab.lib.utah.edu/↩︎

What are we building towards?

For a recent class assignment to make a Collection Builder exhibit, I created an exhibition of the first 10 boss fights from the mainline Legend of Zelda video games, specifically the final blow in each boss fight (https://beeyop.github.io/zelda-death-blow/). What weapon has to be used? Who’s involved in the fight? What part of the timeline, via the Hyrule Historia, does it come from? This was an expansion of a previous project where I looked at repeat objects in the Legend of Zelda series (https://sydbauer.wixsite.com/scaling-stories/zelda ).

I immediately ran into some issues. I couldn’t get the YouTube links to show properly if I wanted to start them at a specific time. I also struggled for a while trying to figure out why a thumbnail wasn’t showing, only to discover that it was an errant capitalization. Frustrations aside, Collection Builder did a really nice job of creating a professional-looking digital exhibition space. For that, I think it fulfills a valuable niche.

I only had one major criticism of the Collection Builder exhibits we examined in class: all the websites felt the same. By the second collection I looked at, that sameness made me gloss over and lose interest in the content. The visual layout was pretty much identical, even with different themes and some custom CSS. I think this is indicative of a larger issue. I believe many cultural institutions view tasks like metadata curation as mechanical, logical chores. In reality, it is a fusion of artistic skills and data skills. If the visuals and experience don’t feel curated to the data, then it is a cute toy, not scholarship or a tool. Some of the exhibits we examined did have a cohesive feel and told a clear story, but I don’t know that they did more than a well-annotated photo gallery.

I think Collection Builder is a gift for smaller museums, organizations, and student projects as a tool for displaying work when you’ve got one, maybe two people working and there isn’t room to expand. In some environments, finding someone with the education and experience in both curatorial work and digital tools would be very hard. Hiring online is an option, but then you run into control issues and management duties. In a single-person or very small team space, hiring out isn’t saving any time or workload the way I think Collection Builder does. I think the well-written and well-organized guide does most of the work of making it a better alternative for that use case. Anytime I wanted to know how to do something with my collection, the guide had an easy-to-understand, easy-to-find, simple process. I have some background in using GitHub and VS Code, but I heard from other people in the class that they also appreciated how well thought out the guide is.

What concerns me is that every time I see a tool like Collection Builder that makes what seems to be a mechanical task, like cataloging, display, or access, easier, I see organizations pushing people to do more with less instead of hiring someone to do these things or paying people appropriately for an increased scope of their job. Budget issues often become the scapegoat, but that is no excuse. Most individuals’ budgets are equally, if not more, stressed than those of any organization they work for. That’s not Collection Builder’s fault by any means, but it is something to note, especially as we decide when to use what tools and what projects to pursue.

In Paige Morgan’s blog post “How to Get Your Digital Humanities Project Off the Ground,”1 Morgan heavily cautions against making a digital humanities project part of your dissertation. The current status of digital humanities projects in academia is reflected in Morgan’s own experience creating projects while working on a separate dissertation. Morgan notes there were times when the dissertation had to take precedence and the projects suffered. That shouldn’t have to be the case, but from what I have experienced and witnessed, not much has changed between when Morgan wrote the blog post in 2014 and today.

While the cautioning is absolutely valid, and a realistic way of looking at the field and the way academia treats digital humanities projects, I think this advice exacerbates the problem. It’s going to take some people who are willing to push back and say, “No, this is a valid form of scholarship,” to really upend the idea that the only valid way to present mastery over information or share scholarship is the often recursive ouroboros of academic paper and book publishing.

With the rapid pace at which people are expected to graduate, to write, to do, we’ve lost a lot of the time to reflect and a lot of the purpose of academic scholarship. Academia must slow the speed and return to a contemplative pace or start accommodating other modes of scholarship as equally valuable and equally valid (preferably both).


  1. Paige Morgan, How to Get a Digital Humanities Project Off the Ground, June 5, 2014, https://www.paigemorgan.net/how-to-get-a-digital-humanities-project-off-the-ground/.↩︎

Maps for Narrative-Building

Many of the visualization methods we’ve been looking at this semester fall under the umbrella of distant viewing, and spatial data is no different. Rather than looking solely at the minute details that make up a data point, we’re allowed to take a huge step back and see what patterns, if any, emerge. Because the purpose of this type of visualization is to help illustrate these patterns, it can be versatile as both a research method and a way to express the results of that research. The process of placing textual data about locations into a representation of three-dimensional space can unearth a number of unanticipated complexities within the data used. This is also a very highly visual and contextual medium of representation, so while we did look at some literature on the topic, it made more sense to see as many examples as we could in order to compare and contrast. 

Béatrice Joyeux-Prunel’s work with the Artl@s was a great introduction, since with her chapter “Digital Humanities for a Spatial, Global, and Social History of Art” we got an inside look into the processes and principles that went into the final product. I appreciated the very balanced look she took in the process of mapping; she advocates for mapping as a research method and not necessarily as a standalone product, and gives guidelines for making sure that the purpose of your maps is clear when they are reduced to static images. However, I’m not so sure the final result of the Artl@s project we looked at (Geography of the Parisian Art Market) was all that successful as a final product. The process of conducting this research may have been illuminating, but as we spoke about in class, the final map does a poor job of elaborating on its purpose, function, and ease of use. Having an adjustable timeline was a necessary feature, but the lack of data at each gallery location makes in-depth analysis difficult. This is especially true when juxtaposed with projects like Mapping Gothic France, which contains exhaustive documentation on each of the cathedrals included in the project. I thought that this project was very well scoped, which seems to be a key to success for digital visualization projects. They knew that location mapping was not the only point of the project- it was just one aspect of physicality, which was what they actually hoped to convey. Rather than 1900+ sparse data points they included ~200 thorough data points, which in conjunction with the time afforded to work on the project set it up for a great final product. 

The shift from standard art historical thinking to cartological thinking also appears to have been a difficult one for both the Artl@s project and the Jaskot and Knowles project we looked at. For Jaskot and Knowles, even coming up with a shared vocabulary for architectural historians and historical geographers was difficult. In the article “Architecture and Maps, Databases and Archives: An Approach to Institutional History and the Built Environment in Nazi Germany,” Jaskot and Knowles describe their experience mapping Auschwitz-Birkenau. One important factor they discuss is the decision-making process to narrow down more generic information on construction into definitive data points. Disallowing these ambiguities feels counterintuitive to standard research methodologies, but in order to represent information in this very binary system, it was necessary. Jaskot asks a question in this article that I think is a much more important question than it seems at first glance: “How accurate did our digital models have to be to provide acceptable answers to our questions?” Rather than letting their judgement calls on preciseness sit as end-all-be-all determinations of fact, they were able to allow ambiguity back in by asking how much of that preciseness is actually reflected in the final product. And, since this project ended up acting as more of a research tool than a public-facing visualization, this still ended up surfacing some interesting questions and observations about the spatial and bureaucratic elements of the camp. 

After weighing all of the examples we looked at, we created our own (much, much simpler) spatial maps. I was very intrigued by the narrative framing of StorymapJS, but didn’t think I had enough time to really give a project in it the detail it deserves. So, I looked at Google Maps instead. For my map, I took a look at tourist traps and roadside attractions; I think they’re such an interesting phenomena (and a wealth of weird vernacular art!), and I wanted to (hopefully) illustrate how the development of highways created and shaped many of these little kitschy spots.

I unfortunately didn’t get super far into the highways part of my map, but fortunately Google maps does display highways. Most of the 20 locations I chose are either in urban metropolises or right off of major interstates, and I was a bit surprised that this held true for both new and old attractions! I’m sure maps like this have been made a dozen times over, but I definitely would like to continue with this little project. I was also curious to see if specific types of attractions were concentrated in particular geographic zones, but I think I would need more data points to really analyze that. For instance, Georgia seems to have a lot of oddities museums and West Virginia has (at least) two cryptid museums- it would be interesting to interrogate why that is. 

Jaskot, Paul B., and Kelly Ann Knowles. “An Approach to Institutional History and the Built Environment in Nazi Germany.” Getty News, February 15, 2017. https://www.getty.edu/news/dah_jaskot_knowles/.

Joyeux-Prunel, Béatrice. “Digital Humanities for a Spatial, Global, and Social History of Art.” In The Routledge Companion to Digital Humanities and Art History, 1st ed., edited by Kathryn Brown. Routledge, 2020. https://doi.org/10.4324/9780429505188-10.

Charting Japonisme

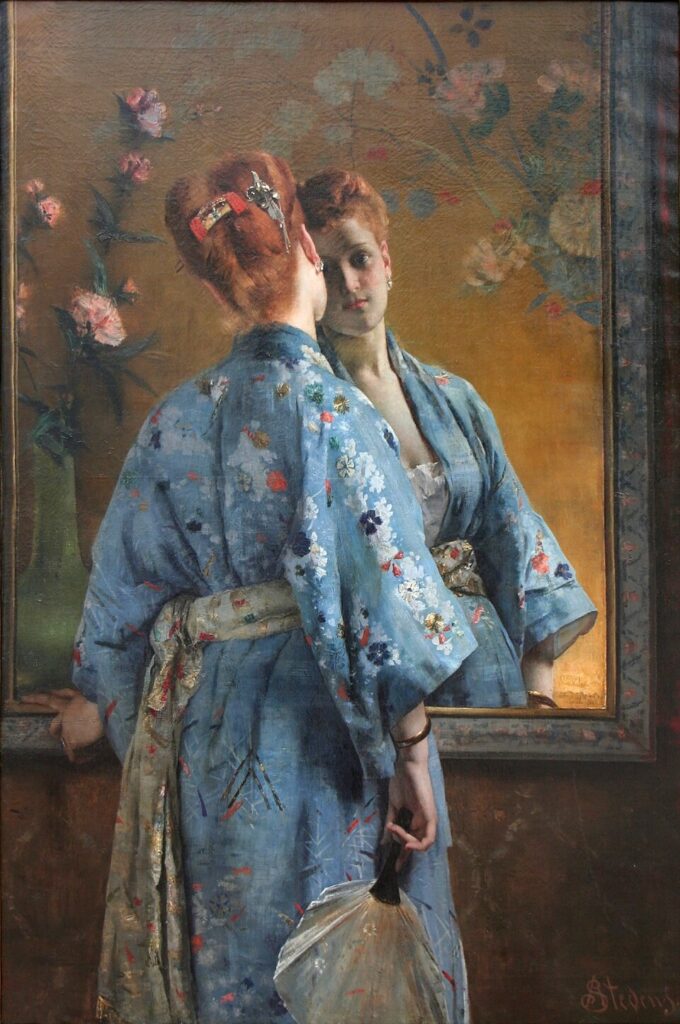
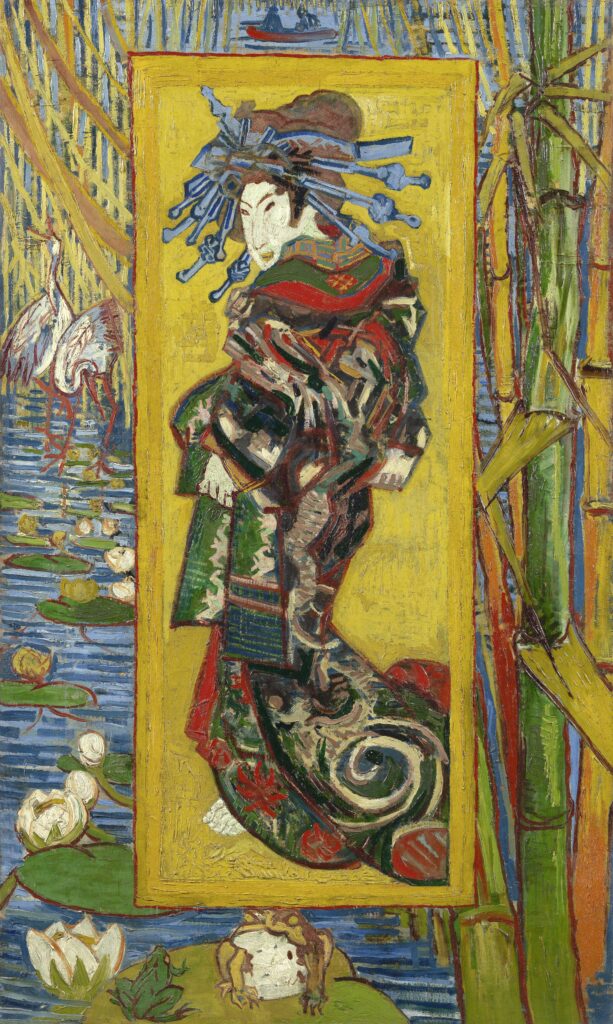
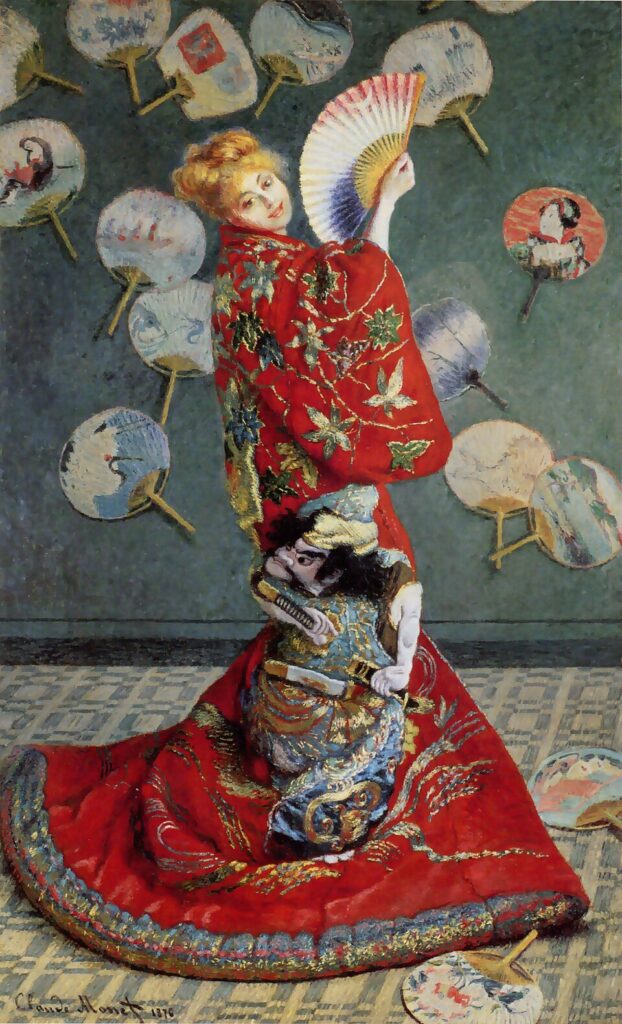
As an undergraduate, I had an idea for my senior independent study thesis that I couldn’t quite figure out how to realize. I wanted to create a digital collection of Japonist paintings from 19th century Europe. More specifically, I wanted to chart out just how quickly Japanese imagery (stylization, recreations, motifs, etc.) and goods (kimono, fans, ceramics, etc.) appeared in European paintings. I had lots of visual data – which is to say, I had knowledge of many works of art that would have fit into my project – and I had a pretty solid research question: just how many works of art fall into the category of Japonsime? The only issue is I had no idea how to even approach such a topic as the scope and methodology just felt too ambitious. Now that I am a masters student, I see how I could use data analysis and digital art history to make my project into reality. So, after six years of rumination, here is my proposal for how I could achieve my academic dream of realizing my project which I shall affectionately title Charting Japonisme.

La parisienne japonaise by Alfred Stevens, 1872.

Literature Review

In 2018 Van Gogh and Japan, Treaty of Kanagawa,

The Courtesan (after Eisen) by Vincent van Gogh, 1887.

Research Questions

Timeline of when it became popular, how prevalent it was, what areas it was most prevalent in. Connect that data to art dealers and track trade movement of real objects.

La collectionneuse au kimono vert by Frans Verhas, 1881.

Methodology

Scope of project to just paintings and just Europe (maybe even just France). One approach to keep this project feasible as a student would be to focus on a specific few artists. I am most notably interested in Vincent van Gogh and Claude Monet. I could use their catalogues raisonnés and chart exactly when they began incorporating Japanese objects and iconography into their paintings.

La Japonaise by Claude Monet, 1876.

Future of this project?

I miss doing this work!!!!!

When the tombstone isn’t enough: how we represent uncertain data

The concept of authoritative data is inextricably linked to Western methods of cultural understanding. When we expect data to be clean, neat, and authoritative, we are leaving behind more complex questions of ownership and history. Susan Elizabeth Gagliardi and Constantine Petridis’s article “Mapping Senufo: Making Visible Debatable Information and Situated Knowledge” makes the case for an expansion of our implicit beliefs about data using West African art as an example. In these cases, Gagliardi and Petridis found typical “tombstone” style data to be insufficient; aside from dubious methods of obtaining provenance from early 20th century collectors, very rarely are these works attributed to a single person or even a single use. In their case, the only things they could identify with any reasonable amount of certainty were the approximate locations that these objects were crafted in. While this has the potential to be the case for a large swath of art historians, there is not a lot of work going on to standardize the ways in which this information is represented in databases. This is an interesting conundrum- the way we structure and standardize data is essential to its legibility and usability, but it is clearly not serving everyone in the ways that it should. While I’m not fully sure I understand the more expressive, illustrative visualization methods proposed for Mapping Senufo, I appreciate that they are grappling with this question and attempting to propose alternative methods of promoting understanding.

A possible design for Mapping Senufo featuring hand-rendered elements, created by Mark Addison Smith after photographs in the Michel Convers collection, Musée du quai Branly-Jacques Chirac, Paris, as presented on January 31, 2020, to the Mapping Senufo team. Courtesy of and © Mark Addison Smith.

The slippery nature of data is easy enough to talk about, but it becomes really clear when you start working with it. In our workshop this week, we took a look at a few visualization methods using API data from the Tate. Each of the 65,000+ entries in the spreadsheet had a reasonable amount of tombstone information in them, but a few factors quickly limited what we could do with the data. Firstly, any field with unstandardized text (or text at all, really) was immediately off the table for generating graphs and charts. This meant that anything with a date range or uncertain creator was inaccessible for this form of visualization. For the Tate this is less of a problem since they do not particularly focus on antiquities, but for many other museums, any level of uncertainty makes data from whole eras and movements inaccessible. This was something I also ran into while working on my CollectionBuilder exhibit– when looking at the material culture of spiritualism in the late 19th and early 20th century, many of these objects were used and refined over long periods of time. Attribution is also further complicated by the fact that many of these objects are a type of ephemera intended to be used in performance and never acknowledged as true objects with authorship- to acknowledge that the “ectoplasm” is a thin linen pulled from the nose of Helen Duncan would immediately and irrevocably alter the purpose of the object by disrupting the suspension of disbelief. While the specific dilemmas any field of research faces regarding the certainty of their classification and identification will be different, this exercise has driven home the point that complete standardization of data is virtually impossible (even with just ten items).

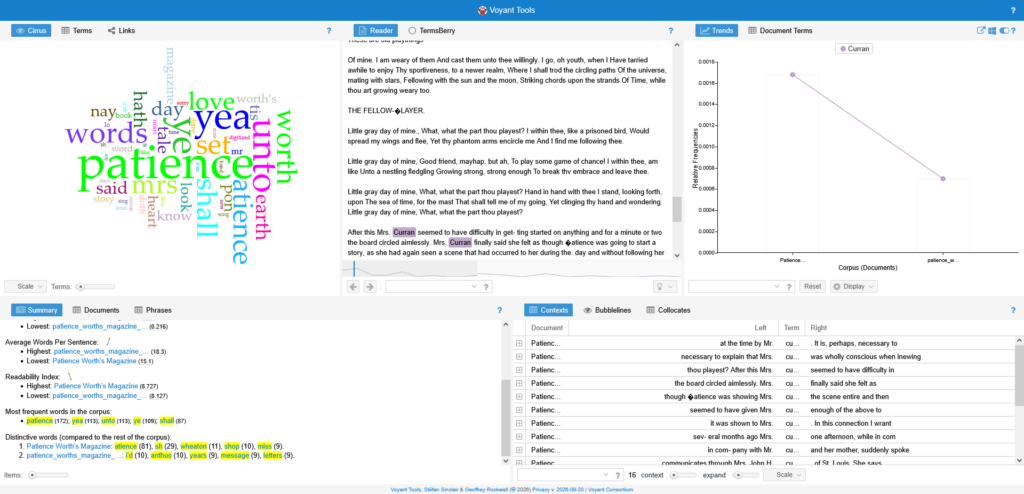
In addition to looking at the textual metadata for images, we also took some time to look into text analysis this week. It was something I had been vaguely aware of, but didn’t quite know the extent of what you could do with it. I thought the project Mining the Dispatch was particularly successful in illustrating what text analysis can do. The tool looks at trends in the Richmond Daily Dispatch throughout the duration of the Civil War; when viewing graphs of multiple trends at once, hypotheses start to form. For instance, viewing trends for clothing advertisements alongside trends of articles mentioning trade can illustrate when some of the effects of blockades were starting to be felt by Virginians. In order to explore text analysis on our own we looked at the tool Voyant, which creates a dashboard of potential textual analysis tools for one or more textual documents. It offers word clouds, trends on word usage, frequency of phrases, correlations between words and phrases, and a number of visualization tools to represent the text.

Since I had a PDF of Patience Worth’s Magazine that I used for my digital exhibit, I was curious what results Voyant would return for the first and last issues of the magazine. The language of Patience Worth is perhaps the most notable and most debated part of her works (besides the authenticity of her otherworldly origin); written in a faux-archaic English, her poems and fiction never seem to falter in their own internal logic system. Voyant offers a ton of different ways to visualize and understand Patience’s notoriously dense writing style as well as track changes from document to document. I was curious to see how mentions of Pearl Curran, the “channeler” of Patience, changed from the first issue to the last issue, and Voyant showed a clear drop in the frequency of “Curran” (most likely because the context of Patience’s writings was long out of the way by the final issue).

Voyant comparing the August 1917 and May 1918 issues of Patience Worth’s Magazine.

Of course this is just a beta version of the tool, but it still was very interesting to see what I could get out of it! And, as we learned this week, the tool is only as good as what you can put into it- these PDFs fortunately had decent OCR, but anything with poor OCR, large files, or more than two pdfs is unusable with this iteration of Voyant.

As for what types of data I might be interested in working with, I’m honestly not too sure. To be frank, I don’t have a clear, defined research topic- everything I drew from this week was from a lifelong personal interest in the occult, not true academic research. However, working with CollectionBuilder these past two weeks has offered me some more interesting ways of using metadata to visualize similarities and differences. I would be interested in using museum APIs to visualize collection data and explore trends, but that does unfortunately rely on museums to have very clear and unambiguous metadata. As we have learned from Mapping Senufo, that can be extremely difficult to come by.

Gagliardi, Susan Elizabeth, and Constantine Petridis. “Mapping Senufo: Making Visible Debatable Information and Situated Knowledge.” The Art Institute of Chicago, December 19, 2022. https://www.artic.edu/digital-publications/37/perspectives-on-data/23/mapping-senufo-making-visible-debatable-information-and-situated-knowledge.

Defining Ambiguity: The Challenge of “Clean” Data in Art History

            The word “data” seems like it strikes fear in the hearts of all scholars in the humanities, especially in a field like art history. While it would be easy to say that the future of art history is inevitably digital, I think that also discounts the work that good data analysis pioneered by art historians can do for the field. Earlier in the semester, we learned how data analysis can inspire creative digital humanities projects and digital collections. These efforts ultimately make art, history, and knowledge more accessible to those around the world. Shouldn’t that be the goal of any good scholarship?

            I had this in mind as I read our assigned articles this past week discussing exactly how to extract this good, clean data that could make knowledge an scholarship more accessible. It turns out, the answer is not quite as clear! Scholars disagree on exactly how to organize data and institutions abide by a certain standard of sharing their data. We saw these opposing views of data organization confronting each other in Susan Elizabeth Gagliardi and Constantine Petridis’s article, “Mapping Senufo: Making Visible Debatable Information and Situated Knowledge,” and Karl W. Broman and Kara H. Woo’s, “Data Organization in Spreadsheets.”[1]

            The main difference between Gagliardi and Petridis’s article and Broman and Woo’s is how they treat ambiguity. Ambiguity and uncertainty is unavoidable in art history and surfaces often with ancient art or non-western art, like the Mapping Senufo project which involved organizing West African art. For Gagliardi and Petridis, they struggled to adequately assign labels to pieces of art that had an unclear artist or origin, owing to the fact that there may be multiple spellings or names for the artist or locations. Broman and Woo suggest that every cell in a spreadsheet should be filled, even if the information is unknown, and to have a standardized spelling or phrase to describe the same piece of data. This is helpful to eliminate inconsistences across spreadsheets, but it may not be truly reflective of the actual data.

In the case of the Mapping Senufo project, assigning a standardized name to an artist or location eliminates the ambiguity and reduces its cultural complexity. This elimination of ambiguity asserts that only one name is correct and any other spellings are wrong, imposing this binary worldview and a misleading authority of certainty. If a date or exact artist’s name is unknown, it would be dishonest to represent an approximation or educated guess as authoritatively true.

Including this ambiguity of the unknown is not conducive to using the data for further analysis, though. In class, we saw how one museum, the Tate in London, combatted this in their publicly available API. The Tate includes a qualitative column next to their quantitative information to explain how and when they simplify their data to format it best for analysis. For example, if a painting was created circa 1840 to 1850, they would include that information in the qualitative column, while a more concrete date, “1840,” is added in the quantitative column. In this way, the museum can be transparent about the information they have while also providing the best approximated information for data analysis.

The key takeaway that I gleaned from this topic of data and data analysis from a humanities perspective is that ambiguity is ok—and necessary—in a field like art history. In an environment where data analysis seems to be an exciting new path towards future art historical scholarship, it may be necessary to artificially “clean” ambiguous data for analysis. As long as the data originator is transparent about ambiguity and uncertainty in their data, I think that it can be responsibly simplified for helpful data analysis.

Text Analysis

            Text analysis is another method that can be helpful for humanities research, including art history. In class this week, we reviewed the Google N-Gram Viewer and the Voyant text analysis software. Even simple functions like counting word frequency or word placement can be helpful for pinpointing main ideas, subjects, or terminology that occur frequently across a corpus of documents.

             For understanding broad trends across all published works, I think that the Google N-Gram word frequency tracker is especially useful. Like most digital tools used in humanities research, this tool identifies patterns, but it cannot provide an explanation for that discovered pattern. For example, in class we discussed how certain words may simply appear less in the 19th century simply because there were less publications compared to the most recent decade. This tool may be helpful for tracking the popularity of certain ideas or concepts, but it is still just a starting point for deeper analysis.

            Voyant seems especially useful for scholars who have several text documents to sift through. Using an example article from a library science course, I found phrases and terms that recurred often throughout the text. It was helpful to see phrases that occurred the most often and where they appeared throughout the text.

            For a research paper, I am examining the book plates in Owen Jones’s 1856 book, The Grammar of Ornament. I think that text analysis with Voyant will be appropriate to use for this project. Before using the Voyant application, I would need to ensure that the PDF of Jones’s digitized work has been properly OCR’d so that it recognizes the text. Then, I can use Voyant to see what words and phrases that Jones uses frequently. This can give me a better idea, not only of Jones’s work, but also of the language that his contemporaries may have used in related texts.

            To further explore Jones’s The Grammar of Ornament, I am considering creating a more comprehensive searchable collection of the book plates in the text. I began this project by uploading ten book plates into CollectionBuilder’s GitHub. To continue this project, I would need to add to the metadata organized in a Google Sheet, including the standard “tombstone” data along with the file identifier. This data can then be converted into a CSV file to be uploaded into CollectionBuilder. This project would not be possible without accessible, data analysis tools.

            Incorporating digital tools into the field of art history does not reduce the role of the scholar. In fact, they can aid in analysis and increase accessibility to this scholarship. There are also creative aways to maintain art history’s ambiguity or at least methods to maintain transparency. Through clean data and data analysis, art historians can integrate digital tools into their methodology, continuing make their scholarship more accessible and innovative.


[1] Karl W. Broman and Kara H. Woo, “Data Organization in Spreadsheets,” The American Statistician 72, 1 (2018): 2-10.; Susan Elizabeth Gagliardi and Constantine Petridis, “Mapping Senufo: Making Visible Debatable Information and Situated Knowledge,” in Perspectives on Data, ed. Emily Lew Fry and Erin Canning (Art Institute of Chicago, 2022).

« Older posts Newer posts »