Women Architects and World Fairs

Category: ARTH 851 Fall 2026 (Page 3 of 7)

The impossibility of “clarity without persuasion”

This week we picked up on a thread that we first touched on in our readings on mapping and spatial narrative-building; in Béatrice Joyeux-Prunel’s article, she states, “[…] when you publish a map, be careful about what it might seem to say.” The operative concept here is “seem,” because as we have seen, the ways in which we present data heavily influence our perceptions of it. Data visualization at its core is a narrative expression of information with all its subjectivity and ambiguity, but the word “data” offers a connotation of emotionless truth that simply isn’t present. Many of us in the class seemed affected by the emotionally charged visualization of gun violence created by Periscopic (as shown in chapter 3 of Data Feminism by Catherine D’Ignazio and Lauren F. Klein), especially when compared directly with the Washington Post bar graph depicting the number of active shooter incidents occurring between 2000 and 2015. Even though they were created for completely different reasons, they ostensibly depict the same phenomena: gun violence in America. And yet, one offers a visceral reaction while the other only offers a vague impression. 

Of course, I feel (or at least hope) that most people understand on some level that data can be represented differently in order to make it fit a narrative. However, it seems rare to me that the deliberate evocation of emotion is not only encouraged, but is the main purpose for the gathering of the data in the first place. This is of course not to say that I disagree with how the information is presented! On the contrary, I think that human impact is something we should be able to focus more on in a world deluged by data. In the example of gun violence, the scale of suffering we are experiencing is terrifying, and it grows every year. It is so easy to let the numbers be numbers rather than let them represent real, human lives, because comprehending suffering on that scale is incredibly difficult! But rebuilding that bridge is central to bringing an ethic of care to how we represent the world and our impact on it. As D’Ignazio and Klein argue, the traditional model of data visualization in which the emphasis is on “just the facts,” writes off ways of communicating information in a way that genuinely resonates with people. Data feminism as a philosophy seeks to challenge this false binary of truth and emotion, offering new ways of looking at and understanding how we represent and communicate information truthfully. Ultimately, it argues that “clarity without persuasion” (as cited by a workshop at the Guardian) is impossible.

I was particularly struck by the example D’Ignazio and Klein gave for the concept of “data visceralization” with the performance A Sort of Joy. There is a lot you can do visually to represent the gap between male and female artists in the MoMA, but it is easy to look once and not really comprehend what it means. By stretching that data spatially, aurally, and temporally, viewers are forced to confront the disparity in a highly uncomfortable way. I had never even considered a data visualization that is not purely visual and two dimensional, but by complicating the “look at a graph to understand the data” experience by removing looking and graphs, it forces a visceral presence in that moment that allows for emotion to surface. It is a highly persuasive representation, but at the same time, there is no untruth to it. Its point is clear and simple without supposition as to the “why” of the phenomenon; that is all on the viewer to determine.

In the vein of outside-the-box representations of data, we also took a look at AI images as a form of data visualization. I won’t lie, as both a digital artist and an information professional I do not have a high opinion of AI in general. Because of the impact on artists and the environment I think you would need to make an absolutely unequivocally solid case for the use of AI in general, and I just have never seen anything that to me justified its use. I’m happy to explore use cases and not write it off completely in case that unicorn use case comes along, but I truly think there is no good purpose for AI-generated images specifically. As Victoria Turk showed in her article How AI Reduces the World to Stereotypes, an image that is the average of everything on the internet is just going to give you the average of images created by the types of people who can access the internet. Although those numbers grow every day, the internet is largely still stuck in a white, Eurocentric, patriarchal world. Describing why this is a problem is preaching to the choir here, but the perpetuating of this singular worldview is an unfortunate and inextricable effect of the technology.

I also took a particular umbrage with Kaylee P. Alexander and Emily Lawhead’s article Data And Discontent: A Converging History Of Photography and AI Art and its conflations with the history of emerging art technologies. While certain technologies may look like magic and there have been artists who use technology to advance their work, they still require an eye for design and executive decision-making by the artist. But, I digress. AI generated images, which in a technical sense fall under data visualizations, at most evoke a curiosity in the current digital social landscape (as in Salvaggio’s Reading AI Art) and at worst are unethically produced visualizations that can cause real harm. I don’t think that ethics are worth setting aside for societal insights.

Keeping everything we learned about what makes a good visualization in mind, we were tasked with creating our own simple visualizations. I will admit that I struggled a bit with getting Palladio to work with the Tate dataset we input into it. I think this may be because I use Firefox rather than Chrome (to ideally disentangle myself from Google a little bit), but it crashed the site for me multiple times. I would love to explore it further with a different dataset at some point, but for the ease of sharing my results, I took a look at WordClouds instead. I input a portion of the first chapter from Skin Shows: Gothic Horror and the Technology of Monsters by Judith Halberstam since I’ve been reading it this month.

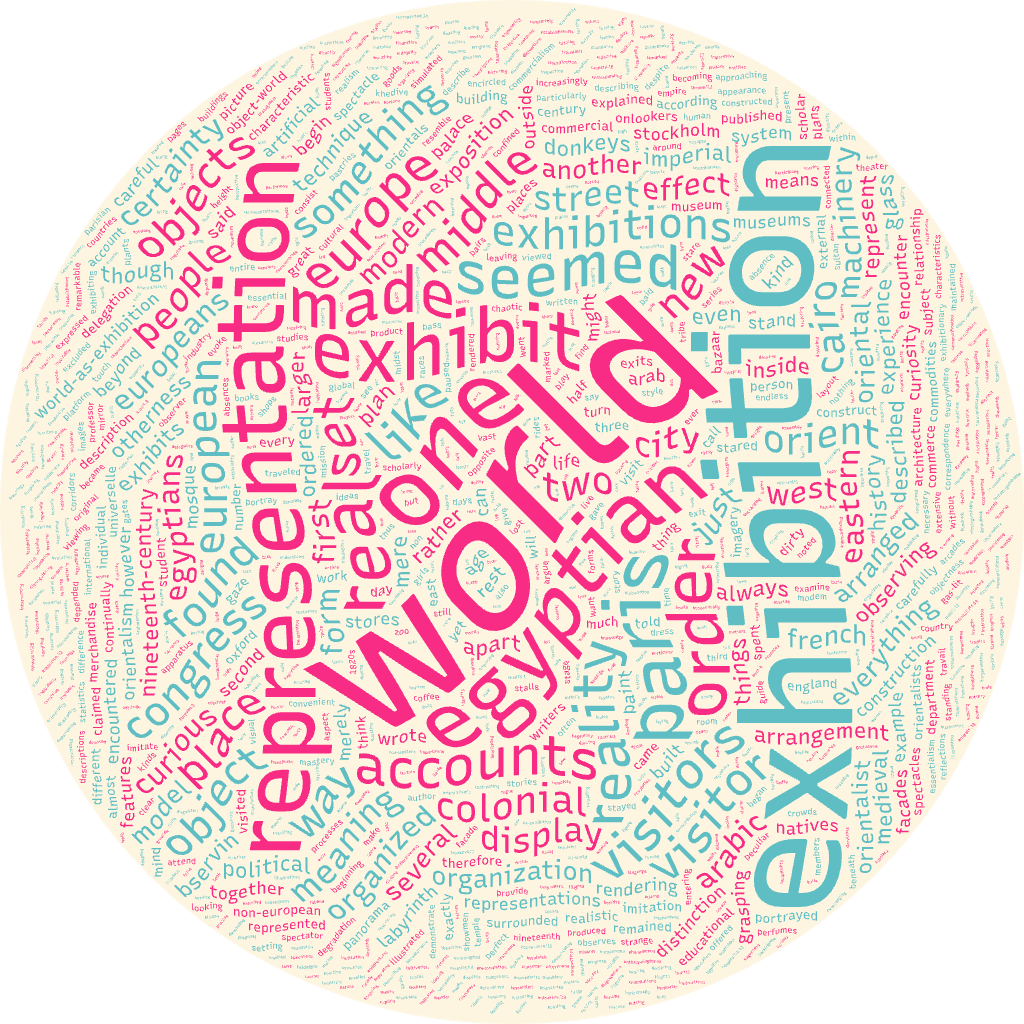
A word cloud generated from approximately 11 pages of text from Skin Shows.

It definitely picked out a lot of themes of the chapter (and the book overall), and I suppose it’s kind of a fun graphic, but I’m honestly not quite sure what I would do with this. I think you could probably glean as much information from the description on the back of the book. Then again, I’ve never been entirely sure what effect word clouds are supposed to have- we made plenty of them in high school, and I never felt like picking out single words did more than fragment my understanding of a text. Maybe it’s just me and my experience though, so I’ll be curious to see if anyone else feels differently and had some breakthroughs for their texts.
Annotation as Accessibility: the way we document non-textual information matters

With this week’s exploration, we took a look at a few of the ways we can attach textual information to visual information. Without being able to explicitly attach contextual information to an image or video, we lose out on entire readings of works and ways of relaying interpretations to future viewers. This also becomes a problem of accessibility in multiple senses of the word. By attaching textual information to images, video, and even audio, they become discoverable. Text can be indexed in a way that non-textual information cannot, and when we are able to flag specific areas of note, we create a more tangible record of what that non-textual information contains. In the second meaning of accessibility, the presence of text as an interpretive layer allows for greater disability access. Subtitles allow for those hard of hearing to engage with video and audio, and for those with visual impairments, the presence of text is necessary for a screen reader to function. By including avenues to attach additional information to image and video viewers, it theoretically becomes easier to expand scholarship on specific works.

In his article “Annotating Upstream: Digital Scholars, Art History, and the Interoperable Image,” Matthew J. Westerby lays out the potential benefits of using annotations to build on analysis across multiple scholars in addition to his more technical descriptions of the functions of IIIF. The field of art history particularly benefits from being able to embed analysis and research findings directly into images (and even 3D models); it allows scholars to point to exact details, filling in missing context and elaborating on often sparse museum-created metadata. The IIIF viewer also allows for a higher resolution of viewing, which encourages close looking and analysis. By being able to reuse, share, and disseminate high quality interoperable images, we encourage the use of “thick data.” Of course, as with many digital projects, there are a number of challenges and shortcomings of this approach that Westerby identifies. Firstly, there is no centralized platform to share this thick data on; analysis can be built upon by pre-existing networks of scholars, but its reach is limited. If we want to annotate upstream in the truest sense of the phrase, there has to be an upstream to begin with. There are of course user-created workarounds and plugins to share annotations, but it can be intimidating for less technologically-inclined scholars to integrate into this workflow. And of course, it almost goes without saying at this point that maintaining thick data in this multi-part form is a digital preservation challenge because of its many moving parts and semi-obscure file types.

We got to try a little bit of video annotation ourselves to see how it looks in practice through Panopto. After the Westerby article, I was curious to see what more art historical annotations would be like, so I brought in a video from my favorite artist duo: Janet Cardiff and George Bures Miller. If you are unfamiliar with them or have never had the privilege of seeing one of their pieces live, Cardiff and Miller construct looping, immersive, multi-media narrative works featuring animatronics/moving parts that are sometimes contained to singular rooms or scenes. I originally considered annotating my absolute favorite work of theirs, Opera for a Small Room, but unfortunately it doesn’t film particularly well. There’s a moodiness and a physicality that just doesn’t come across in video; not being able to move around the piece and feel the sound breaks the immersion (and Cardiff and Bures Miller rely a LOT on sound!). I had originally thought that maybe annotation could fill some of those gaps, but after annotating, I was a little frustrated that it just couldn’t replicate the experience of watching this piece. So, instead, I looked at The Marionette Maker, which is a similar piece from Cardiff and Bures Miller with a less direct, linear storyline.

While this video representation is still not perfect and misses a lot of the aura of the original piece, I enjoyed being able to mark it up like you would be able to for a static piece. Since there are no spoken words in The Marionette Maker, I added a few bits of analysis and transcriptions for the general soundscape. I have also edited the video down to a more appropriate length for this example from the full 11 minute and 11 second video available on the artists’ website. Please forgive some of the awkward cuts; I tried to cut down on the amount of time the camera lingers on each setpiece, but had a bit of a hard time getting precise in Panopto. If you’re interested in the full video, here is the youtube link (and some higher resolution photos so you can see the craftsmanship!). Don’t forget to open this video in Panopto to see the added notes.

Practicing annotating videos led well into our discussion on oral history. While a small number of traditions prefer to focus on the purely aural aspects of a recorded interview, most rely on transcripts and annotations to make their content accessible (and indexable). As someone who has been working in a small museum for two and a half years, I’ve had direct experience with how vital (and difficult) it is to make oral histories accessible. Since the museum is owned by the City of Raleigh, we face specific municipal pressures to have a collection that is of and for the people of the city; this means that when we accept anything into the collection, it’s important that we are able to make it accessible to laypeople and not just researchers. However, because we don’t have transcription software, every bit of typing and indexing we do is entirely by hand. It takes a lot of work (and a few janky workflows) to get the dozens of oral histories in our collection into a state that is even remotely searchable. 

Because of this, we have experimented with automated transcription for a project interviewing former students of Ligon High School. For some quick background, J.W. Ligon Junior-Senior High School was one of two of Raleigh’s black public high schools, and considered to have a particularly excellent teaching staff; many students went on to become STEM leaders in the Triangle area. The school operated as a junior/senior high school for 18 years before the desegregation of Raleigh public schools, and every year on the weekend of July 4th, alumni gather for a reunion. Some of these people have donated to the city’s historic collections before, so we have been trying to have a presence at these events, putting together small exhibits of Ligon items we have in the collection and operating an oral history station. Although the interviews only last 10-15 minutes, we still get about a dozen per year. Recently, when we had a several year backlog, we attempted to do some automation with our transcripts, which honestly did not save us much time. Transcription software tended to have a very difficult time deciphering the heavy accents of our interviewees, and it did awfully at understanding place names, so we had to go back in and basically rewrite the transcripts. It also of course did not understand any of the contextual information that we understand as stewards of this history- how could it possibly know that “the rat box” was what people called the movie theater on Hargett Street and index it appropriately? 

I have a lot to say about oral history as a practice but in short, without being able to add that context back in, holes start to appear in the historic record. 

Westerby, Matthew J. “Annotating Upstream: Digital Scholars, Art History, and the Interoperable Image.” Open Library of Humanities 10, no. 2 (2024). https://doi.org/10.16995/olh.17217.

The Fate of Art and Art History in a Data-Dominated World

            This week we read an evaluation of different methods of visualizing data—their strengths and their flaws. Catherine D’Ignazio and Lauren Klein take on the question of authority and perspective in data visualization in a chapter in Data Feminism while Nathan Yau explains the numerous ways in which data visualization can be construed while still maintaining its aura of objectivity in “Defense Against Dishonest Charts.”[1] Eryk Salvaggio and Victoria Turk analyze how biases and gaps in data appear in one of the newest forms of data visualization, artificial intelligence (AI), in their result reports for experiments they had conducted using AI.[2] Kaylee Alexander and Emily Lawhead posit a more optimistic view of AI by placing it within the context of other media inventions like photography. These various articles all grapple with what it means to live in a world not only inundated with data, but also with generative technology that can process data by itself.

            Ignazio and Klein’s article is a good place to start to challenge this idea of rational data visualization. Sure, numbers and statistics can be collected objectively, but the story they tell can be communicated powerfully—and even emotionally! —to the viewer. Take Periscopic’s data visualization of US gun deaths in 2013, an example used by Ignazio and Klein. The data collected and displayed are quantitative, the amount of people killed by guns and the number of more years these victims could have lived had they not been cut short, but it is communicated in a way that allows the viewer to better visualize this loss. Unlike a chart or plot of the amount of mass shootings, this graph focuses on the victims rather than the crime and associates the number of people killed with the amount of time they could have lived. Taken together, this visualization of data illicits an emotional reaction.

            Yau describes in “Defense of Dishonest Charts” how data—objective, quantifiable data—can be visualized to prove one point better than another. Laying out the basics of data visualization and good data visualization practice in “Representing Data” in the book Data Points: Visualization That Means Something, in this article, Yau describes how data can be manipulated through different elements of data charting and how to be a vigilant consumer of this data. His article is written with the assumption that data visualization features like graphs automatically signal to readers a sense of objectivity.

            Artificial intelligence generates images and responses from massive amounts of data scraped from across the internet. Salvaggio and Turk use artificial intelligence image generators to explain how artificial intelligence processes this data to create the most “average” of images in response to prompts, and in consequence reveal both gaps and biases in data. Salvaggio explains that the images produced by artificial intelligence are not so much pictures as they are representations of data. Any weirdness or distortion in images, like those produced in the images of people kissing, is attributed to a lack in adequate data to create these images. In Salvaggio’s case, a bias was revealed that showed predominantly single-race, heterosexual couples. His study was run in 2024, so the picture-producing ability of AI has likely increased dramatically, but it still likely features similar biases.

            Turk’s article on AI image generation focuses exclusively on generated images that reproduce stereotypes of cultures and gender ideals. The article artfully incorporates interaction with the different images produced by AI and highlights common themes across prompts. For example, the inclusion of chopsticks in images produced of “Chinese food.” Turk’s article demonstrates how AI is like an echo chamber of western stereotypes of other cultures. A fact that Ignazio and Klein also address in their article about unobjective data visualization. Like Turk, Ignazio and Klein reveal how the authority of the west, best embodied in a white male perspective, underlies most data visualization tactics. In this way, these stereotypical images of cultures produced reveal how western assumption of other cultures—eerily reminiscent of nineteenth-century imperial colonial efforts to visualize and display non-western cultures—is still largely at work within existing data.

            While I did not use AI images to visualize data, I used the more accessible Tag Crowd to create a visualization of words used in Timothy Mitchell’s “Orientalism and the Exhibitionary Order.”[3] The word cloud did extract words that communicated the main themes of Mitchell’s seminal text including “world,” “exhibition,” and “representation.” A closer look at words used less frequently, like “Egyptian,” “European,” “objects,” “colonial,” and “nineteenth-century” may even reveal to a person who has not read the text before a general idea of what it is about. In this way, I think that a word cloud to visualize quantitative data, the frequency of a word used in a given text, is helpful more as a pedagogical tool or method to communicate themes of one’s research.

            Turning to Alexander and Lawhead’s article “Data and Discontent,” they argue that art created with artificial intelligence will be the way of the future and that the fear and anxiety produced by its entrance on the global stage will be abated within time like that of photography. As a class, we discussed several flaws to this idea. Despite the human required to create prompts, it seems as though the hand of the human is largely out of the loop. Can a person really make art from a mass of art-as-data available freely to be consumed and processed by AI models? The answer we concluded with was a resounding no.

            Despite its claims to objectivity, data visualization is anything but. This has only been amplified with the advent of artificial intelligence. In a world increasingly flooded with data, it is the now, more than ever, the responsibility of the consumer to critically analyze how to use this data.


[1] Catherine D’Ignazio and Lauren Klein, “On Rational, Scientific, Objective Viewpoints form Mythical, Imaginary, Impossible Standpoints,” in Data Feminism (MIT Press, 2020).; Nathan Yau, “Defense Against Dishonest Charts,” accessed October 25, 2026, https://flowingdata.com/projects/dishonest-charts/.

[2] Eryk Salvaggio, “How to Read an AI Image,” Cybernetic Forests. Last updates August 2024. https://www.cyberneticforests.com/news/how-to-read-an-ai-image.; Victoria Turk, “How AI reduces the World to Stereotypes,” Rest of World, October 20, 2023, https://restofworld.org/2023/ai-image-stereotypes/.

[3] Timothy Mitchell, “Orientalism and the Exhibitionary Order,” in Grasping the World (Routledge, 2004): 442-460.

Obverse and Reverse: A Network Analysis of the Roman Coins of the Two Faustinas, ca. 138-180 CE (Bonus!)

13 October 2026 Designed by researchers at Stanford University, Palladio allows users to visualize their data through spatial maps or network analysis with just a CSV. Since we have already worked with spatial data in this course, I focused on the network analysis tool in Palladio to enormous success. I elected to upload a pre-existing […]

Art History and Mapping

October 4th, 2026

“How do art historical questions and evidence intersect with geographic concepts and digital mapping methods?”

This question opens Paul Jaskot and Anne Knowles’s article about their work mapping and spatially visualizing concentration camps during the Holocaust. Over the course of the article, the authors give us a look into how their own research evolved over time largely due to the challenges and new perspectives furthered by working with GIS mapping technology.

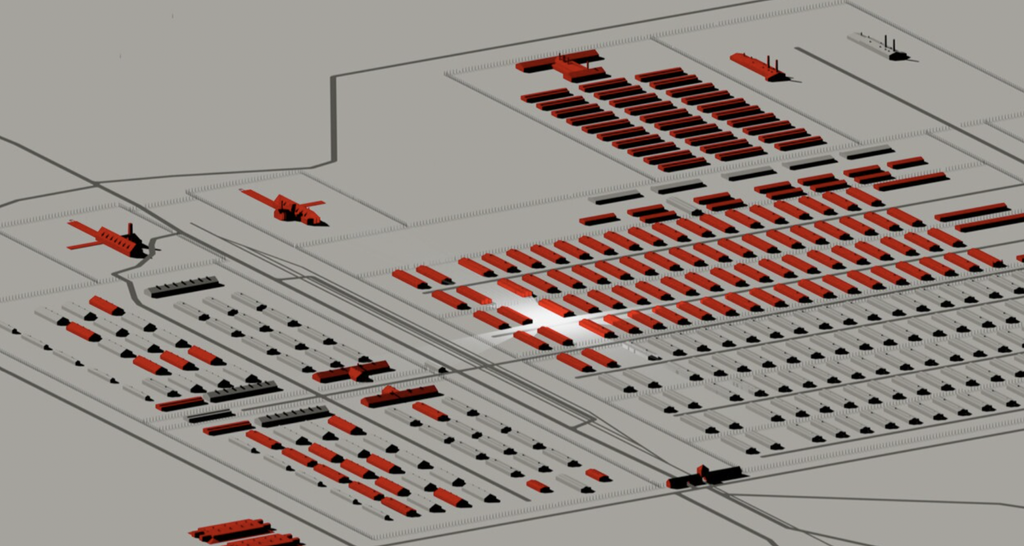
The project itself was a collaboration between art historians, historians, and GIS specialists to use GIS to visualize the development of the SS camp system over time. The first hurdle was the quality of information available—a running theme in digital art history. Though the Nazi Party kept detailed documentation, this cannot always translate into the specific coordinates or specific dates necessary for GIS systems. Translation becomes an issue here, especially in historical contexts as filled with trauma and violence as the Holocaust. Data will never be able to convey the emotional weight of these specific times and places, which is something the research team considered when they were making their model of how the Auschwitz camp expanded and evolved over time. Nonetheless, the process of visualizing the camp’s changes brought to the fore new and important research questions for the scholars.

Plan of Auschwitz-Birkenau, with red shading indicating buildings under construction or significant repair from May 1943 to May 1944. Reconstruction and map (as of state of research 2010) by Chester Harvey.

To answer Jaskot and Knowles’ opening question, art history certainly intersects with  geographic concepts and mapping—art history is, after all, still one approach to writing history, a field to which, geography, and the changing of space over time hold clear weight. Maps could allow us to visualize evolving political geographies (like national borders) and the development of different art movements, the building of monuments, etc.

Though there are so many obvious use-cases for mapping as applied to art history, the field itself lacks training in creating maps and often lacks the motivation for using them. For better or for worse, it’s a convention of the field that we begin our study with the art object, and it is this quality which makes art historians averse to viewing a map as a main source of inquiry. Particularly for contemporary art historians, merely mapping the location or structure of the works we study wouldn’t always yield interesting results, as artists tend to be centered around big population centers or universities, which would not always generate an interesting map.  

I myself ran into issues when trying to apply mapping to my own art historical research. Contemporary art is often well-suited to digital projects, with many artists using digital tools in their own work, and I really enjoyed making a small archive of surveillance art in collection builder last week (see here). However, when it came to mapping, I struggled to think of a map that would be useful for my research purposes. If I were to map the physical locations of the installations I study it would look like a huge cluster in New York City, a smaller cluster in LA, and some scatters throughout the rest of the country: affirming what we know about the major art centers in America. I considered creating a map which focused more on surveillance specifically, thinking of the pre-existing Flock camera maps (see here), but quickly thought that I don’t have the technical capabilities to do so.

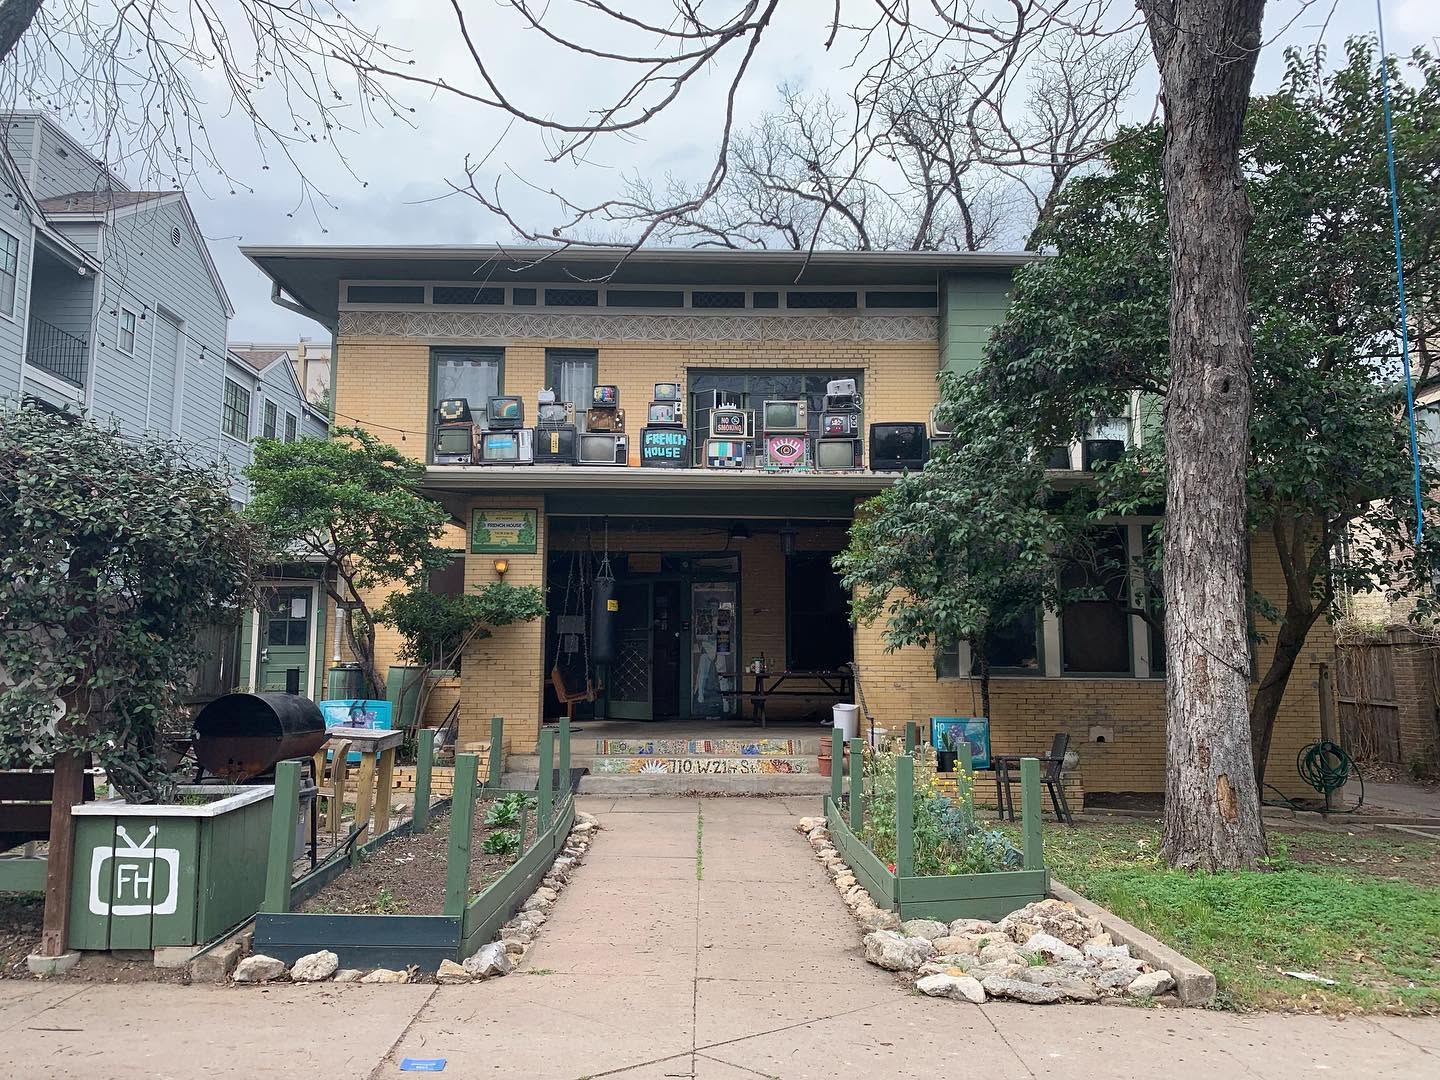
Though I know I could fruitfully connect mapping to my research if given the time, I decided to make a map about a more personal project instead: cooperative student housing in Austin, Texas. As an undergraduate I lived at a number of these “co-ops,” and aside from providing me essential social support and housing, I was always interested in the architecture and history of these homes. Austin is a relatively new city, and its population boom was only in the 2010s, so much of the town is populated by new builds. Co-ops, on the other hand, often originated as depression-era group houses which means many of the buildings date to the 1920s.

French House Co-op, ICC (Inter-cooperative council) Austin, in 2019. The house was originally built in the 1920’s, and still has many of it’s original features, like the decorative molding on the front of the home. This is where I lived for the last two years of my undergraduate experience.

Considering Jaskot and Knowles’ proposal that a mapping project ought to be led by spatial questions, the spatial question in this case might be how the presence of the University of Texas affected the distribution of cooperative houses. That said, the other reason I made this map was in the hopes it might be useful to the co-op councils that are in charge of these houses, either for promotion and visibility or logistics. There is always, always, the fear that cooperative housing will cease to exist because of a lack of funds. In a city full of aggressive housing developers, I shudder to think of what might happen to these historic homes if they had to go for sale. This project felt like a small way of giving back to the community that supported me.

The overlooked creative practices of metadata tracking, annotation sharing, and boundary setting

Matthew J. Westerby opens his article “Annotating Upstream: Digital Scholars, Art History, and the Interoperable Image” with the story of how downstream uses of the British Library’s IIIF images and manifests lost their own access when the Library was the subject of a cyberattack. This domino effect showed a “change in the relationship between institutions and users of online collections in which separate layers exist to serve images and also to present the digital surrogate of a real-world object like a book.”1 Similar complex layers of delivery and downstream/upstream usage have been on the minds of video game scholars for a long time. There is always a layering between the game’s software and the hardware or the display, as well as between the game as code and the physical object that carries that code, such as a cartridge. Especially with online-all-the-time consoles, a game can be pulled or updated or changed at any time without user consent or warning. These delivery layers are perhaps more apparent to the average gamer than the average user of an IIIF image art surrogate because they have demonstrably affected how games are released and experienced. It is now common (though not acceptable) practice for a game to release in a broken state with day-one patches to download. Patching post-launch was a near impossibility before internet-connected gaming, so the uneven quality of games at release has been felt by all video gamers.

This is not the only place where Westerby’s suggestions and insights for art history run parallel to emerging practice in game studies. Annotating video games is one way game studies is looking to share knowledge weither via annotating games themselves, annotating screen captures of video games, or through examining existing annotation practices like wikis and let’s plays that are a part of the larger life of “networked hyperlinked videogames”.2 For the practice part of this post, I used Panopto to experiment with annotating a brief screen capture of me playing The Blood of Dawnwalker.3

Annotated video incoming, technical issues, check back by Tues 10/5

One of the reasons wikis are such a robust source of information for video games is that they are such complex artworks that one person could never annotate a full game by themselves. It also adds to the robustness of scholarship when sharing is part of the process, not just the outcome. The Zelda object-focused digital humanities project4 that I mentioned in my post about Collection Builder was one project that used this style of sharing. My portion was about multiplicity and repetition of objects in the Zelda series, focusing on small keys, but I was doing it alongside Sydney Bauer whose object was a single American painting, Hannah Iovanna who was examining the still life paintings of a single artist, and Addie Magyar who worked with me on the Zelda portion and also acted as coordinator (Magyar was actually who noticed that small keys are the only constant in all the games). Being able to do those separate case studies with the same methodology while in communication during the process made the projects much richer and more enjoyable. Our discussions and brainstorming sessions brought up the question that I swear one day I will write about: why is there always a wheel of cheese with one little slice out in every video game? I sometimes wish I had picked the history of the wheel of cheese with one little slice out as my art history thesis: a study of why it is the most filling and delightful of foods across time and medium.

Annotating interoperable images is a mode of scholarly communication that is fundamentally different from the traditional sharing of only finished writing in journals and academic press books but no less a creative or scholarly act.5 When there’s a wider variety of acceptable ways to communicate information, writing a book or a journal article becomes a choice, not an obligation. The quality of all scholarly communication increases as forms increase because the output mode is not just one default option regardless of the needs of the argument or the data. This also allows for more modes of scholarship that cannot be studied or communicated as well via paper alone, like GIS mapping projects from my previous post. I was unfamiliar with the idea of thick data or data pollution6 as terms when I wrote the mapping post, but they are great terms for the concept I was exploring at the end of that post: messy data that balances the line between being so messy it’s no longer a useful tool but isn’t so clean that it carries unquestioned authority with data pollution also covering the source of data like AI or how data is used.

Westerby’s choice to end the article with how you can’t control other people’s usage of your images or metadata if you share them, and how the fear of misuse should be a known risk but not a reason to abandon openness was nuanced and powerful.7 There will always be people who take good things and warp them. Making decisions based around absolute prevention of misuse is an impossibility and an unnecessary burden. It is better to work from being risk-aware, with practices like the usage tags that Westerby suggests.8 It reminded me specifically of the Wretched & Alone SRD,9 a system written by Matt Sanders for making solo journaling games in the style of Chris Bisette’s game The Wretched.10 The Limitations section of the SRD includes “Finally, nazis, homophobes, transphobes, and other bigots are expressly forbidden from making new content using the Wretched and Alone system. If you have to ask whether this includes you, it does.”11 Are parasites going to ignore the usage terms? Likely. Still, by making clear the usage and specifically taking a stance on who is forbidden to use the material, bigots cannot hide behind not knowing or accidental infringement. It makes the deliberate nature of the theft apparent.


  1. Matthew J. Westerby, “Annotating Upstream: Digital Scholars, Art History, and the Interoperable Image,” Open Library of Humanities 10, no. 2 (2024), https://doi.org/10.16995/olh.17217.↩︎

  2. Austin Anderson, “Dark Souls as Networked Hyperlinked Videogame,” Electronic Book Review, ahead of print, September 28, 2025, https://doi.org/10.64773/1f7a-df6c.↩︎

  3. “The Blood of Dawnwalker – A Dark Fantasy Narrative Sandbox RPG,” The Blood of Dawnwalker – A Dark Fantasy Narrative Sandbox RPG, accessed October 5, 2026, https://dawnwalkergame.com/us/en/home.↩︎

  4. “Scaling Stories,” Scaling Stories, accessed October 5, 2026, https://sydbauer.wixsite.com/scaling-stories/interactive-feature.↩︎

  5. Westerby, “Annotating Upstream.”↩︎

  6. Westerby, “Annotating Upstream.”↩︎

  7. Westerby, “Annotating Upstream.”↩︎

  8. Westerby, “Annotating Upstream.”↩︎

  9. Matt Sanders, “Wretched & Alone System Reference Document V1.1,” SRD, with Chris Bissette, Sealed Library, 2020, https://sealedlibrary.itch.io/wretched-alone-srd.↩︎

  10. “The Wretched by Chris Bissette,” Itch.io, accessed October 5, 2026, https://loottheroom.itch.io/wretched.↩︎

  11. Sanders, “Wretched & Alone System Reference Document V1.1.”↩︎

The dangers of cartography: I made a map and now I have to plan a trip to get a Braxxie lantern

Behold the Cryptid Art map!

The inspiration for my Cryptid Art map was growing up hearing tales of the Mothman and the Braxton County Monster (also called the Flatwoods Monster or Braxxie to her friends). The Mothman has risen in fame in the last decade, and yet most people I talk to who know the Mothman is from Point Pleasant, West Virginia, only know that as a general factoid or from the video game Fallout 76. Most have no idea the Mothman has any connection to the 1967 Silver Bridge collapse, which is a shame.

It may seem strange to connect a massive infrastructural disaster that ended in the deaths of 46 people and the creation of the National Bridge Inspection Standards to the celebration of a cryptid. But the lore of both is deeply intertwined. The Mothman was seen perched on the Silver Bridge the day before it collapsed, and so has taken on the status of an omen or, more charitably, the idea that he was “trying to warn us.” The tragedy was also caused by systemic infrastructure failure, a reason not to trust what the government tells you, a common theme in West Virginia stories. The danger of trusting the faceless people in power is echoed in the phrase that I heard most during the Mothman Festival hayrides and have a pin repeating: “Don’t fear the Mothman. Fear the Men in Black.” The Mothman behaved like an animal, and so could hurt someone, but never with malice. The Men in Black who came after from the government were the ones who threatened people. Admittedly, it’s a paranoid viewpoint. But given West Virginia’s history, from the Mine Wars to vote buying, and most recently the opioid crisis, I don’t think it’s a misplaced view.

I used Google My Maps1 for the Cryptid Art map, but I also explored Knight Lab’s StoryMapJS.2 I chose My Maps because it focuses it’s display on place, while StoryMapJS prioritizes content. Many of the artworks and related sites have very little information available, so a small description and image work well. For pins with more information available, it is nice to be able to focus on the most unusual or helpful source, like using the Braxxie lantern documentary for the Exxon station where they are sold. StoryMapJS is better for focusing on the object first and the location second, particularly in how it pulls up a large secondary window for the embedded material for each pin. When I was thinking of projects that might work with it, I was thinking of comparatively looking at falconry gloves within different archives and museum collections: where they were found, where they were made, where they were used, and where the material was sourced. This is also reflected in how StoryMapJS uses fixed icons that are tied to the type of material embedded and also the ability to control the order that pins are navigated through.

I think there is some baked-in skepticism of the accuracy and completeness of maps that maybe isn’t there for museum exhibitions, and that skepticism is valuable to engage with. Because we’ve probably all had a GPS app try to take us down a closed road or otherwise lead us astray, it’s all the more illuminating to notice how much maps can be used to both enforce and question authority. Béatrice Joyeux-Prunel in her chapter for The Routledge Companion to Digital Humanities and Art History, uses the example of how nationalists (including the Nazis) use “artistic geovisualization” to claim spaces, heritages, and artworks as their own and to justify their crimes.3 Joyeux-Prunel continues by explaining how art history is returning to cartography via digital mapping because it allows new questions to emerge “that had been buried for a long time, either because they could be embarrassing (such as the place of origin of a style, too often understood as a ‘center of influence’), or the geopolitics of art, or because they could not be given satisfactory answers[.]”4

An excellent example of case studies that ask all three of those types of questions and investigate them with “Historical Geographic Information Systems (GIS) methods” is Paul B. Jaskot and Anne Kelly Knowles’ “An Approach to Institutional History and the Built Environment in Nazi Germany.”5 In my opinion, the case studies have the added benefit of dejustifying Nazi crimes by picking them apart and not allowing them to hide in historical assumption. Mapping the SS camp system and the architecture of the SS camp at Auschwitz-Birkenau, Knowles and Jaskot used different sources of information and visualization approaches. What they had in common was how GIS was able to shed new insight even in a field as highly studied as the SS camps and raise new questions because it was able to connect information to a spatial context.6

Building my own map, I was surprised by how difficult many of the decisions I needed to make were and how they immediately made me realize I was creating from a position of authority whether I wanted that or not. One of my earliest decisions was whether to pin the Silver Bridge Wall mural. The Mothman and Silver Bridge stories are connected, but they are not the same. Still, the Mothman stripped of the Silver Bridge is stripped of an important part of its history in Point Pleasant. So I included the mural, with a simple description focused on the purpose of the map: “The Mothman was seen on top of the Silver Bridge the day before it collapsed, leading some to believe he is an omen of doom or was trying to warn the town of the approaching tragedy.”

I plan to continue to work on my Cryptid Art map with the mission that there should be art of cryptids in their hometowns (as long as those communities want it). So in the future I plan to add cryptid origin points even where there isn’t art yet. I may also add local artists who make cryptid art. Lately, instead of worrying whether something fits a set of rules or parameters, I’ve been asking whether it’s kinder to include it than to leave it off. Being messier but kinder in action is perhaps how we keep tools with an inherent authority, like cartography, from having so much power to warp or control. The future of transparency in digital tools may be to strip back the veneer of clean data and UIs without losing the purpose of the tool, embracing messiness and a degree of friction so that questions naturally arise about where the information comes from and who decided its presentation.


  1. “My Maps,” accessed October 5, 2026, https://www.google.com/maps/about/mymaps/.↩︎

  2. “StoryMapJS,” StoryMapJS, accessed October 5, 2026, https://storymap.knightlab.com.↩︎

  3. Béatrice Joyeux-Prunel, “Digital Humanities for a Spatial, Global, and Social History of Art,” in The Routledge Companion to Digital Humanities and Art History, ed. Kathryn Brown, Routledge Art History and Visual Studies Companions (Taylor & Francis Ltd, 2022), 88–89.↩︎

  4. Joyeux-Prunel, “Digital Humanities for a Spatial, Global, and Social History of Art,” 89.↩︎

  5. “An Approach to Institutional History and the Built Environment in Nazi Germany,” accessed October 5, 2026, https://www.getty.edu/news/dah_jaskot_knowles/.↩︎

  6. “An Approach to Institutional History and the Built Environment in Nazi Germany.”↩︎

Annotations and Transcripts: The Significance and Utility of Thick Data

            Oral histories and videos are sources that can be especially useful for art history. Oral histories are an important source for collecting stories from people who have first-hand experience, and videos may be the medium of an artwork or a method of its documentation. Oral histories are great primary sources that often capture different information from written sources. It seems that oral histories require the researcher to consider more thoughtfully who the interviewee is, who the interviewer is, and what questions are being asked compared to written and spatial or map sources. This week, we reviewed how to practically refine oral transcripts and annotate videos to make these sources more accessible for research.

Matthew J. Westerby proposes in “Annotating Upstream: Digital Scholars, Art History, and the Interoperable Image” that scholars should create their own metadata from publicly available images and sources. Westerby explains that IIIF annotations, the International Image Interoperability Framework, are useful for standardizing formats of images and videos for accessible sharing, but they may not suit the needs of the scholar using them. To solve this problem, he suggests “annotating upstream,” or, in other words, the scholar adds his or her own annotations in addition to the data received by the institution providing the image. This “knowledge-de-centralization” mitigates institutional bias and allows for individual scholars to personalize the media to their own needs. Making these annotations publicly available can create media with what Westerby defines as “thick data,” or digital images with a lot of description added by multiple people on top of the IIIF provided by the institution. Rather than accepting the “downstream” annotations, the scholar can enhance the context surrounding an image.

In the workshop session of class, we practiced annotating videos. The annotations for images that Westerby describes in his article can also extend to videos. In class, we used a clip from The Cotton Club, the 1984 film directed by Francis Ford Coppola, to practice writing annotations.1 These annotations focused exclusively on the set design and cinematography of the scene. Another scholar may be interested in a different aspect of the film, like the music or dialog. Annotations created by different people for different purposes would create the “thick data” that Westerby describes. Public annotations on digital content create a new area for scholarship generation and analysis.

I also experimented with annotating video—albeit on a much simpler scale. I refined a short clip from the 1964 stop motion Christmas television special, Rudolph the Red-Nosed Reindeer, produced by Rankin/Bass Animated Entertainment with the online platform Panopto.2 Panopto allows the user to correct the dialog transcript for captions, post interactive discussion posts, and notes. The discussion posts and notes are timed with specific moments in the video, making these features especially helpful for internal research note-taking or film class discussion questions. I included notes that explained the commercial origins of the story, song, and movie of Rudolph the Red-Nosed Reindeer alongside individual frames in this short clip. While I added notes contextualizing the origin and creation of the Rudolph story, in an attempt to reveal the ultimately commercial basis of this classic Christmas tale, another scholar may be interested in the technical processes of stop motion animation. In this way, we would each create different annotations for the same digital object, creating “thick data.”

Rudolph the Red-Nosed Reindeer, Rankin/Bass Entertainment Animation (1964)

By pressing the right upwards arrow button, the user can navigate to Panopto, where he or she can view my video annotations.

 Although I do not have videos or oral histories pertaining to my research right now, Panopto will be useful in the future if I need auto generated and editable captions as well as timed video annotations. Interfaces like Panopto are accessible, practically helpful, and fairly intuitive for the scholar to use for producing and refining oral history transcripts and videos. Panopto’s editable captions and notes are especially helpful for the internal research process rather than a public-facing final “project.”

The Institute of Museum and Library Services provides a thorough guide to beginning an oral history project. Linda Shopes’ article “Making Sense of Oral History,” a part of the Institute’s “Oral History in the Digital Age” site, delineates features of oral histories that should be considered by the scholar who is using or creating them. Some of these nuances include recognizing who is being interviewed, who the interviewer is, and what questions are being asked. She also reminds the reader that oral histories are based on people’s own subjective experiences and recollections, so they should not be accepted as fact. She uses several examples throughout this article to illustrate her points. For example, she provides different perspectives on the same experience within one family, and the reader can identify how each interviewee’s answers are formed based on their role within the family (e.g. father, mother, and daughter). She also uses the example of a former enslaved woman interviewed by a young. Black man in comparison to a white, female social worker. In this interview, the reader can see how the interviewee is much more candid with the Black interviewer in comparison to the subdued, practiced answers for the white woman. These considerations outlined by Shopes led me to think about how I should use oral histories in my future research, knowing that they are important but also subjective, living documents.

I think that creating, refining, and using oral histories for research is a promising direction for a more “digital” art history. If oral records exist documenting artists and their art, they will be a relevant and useful primary source to incorporate into research. Annotating images and videos also generate greater scholarship and context for non-experts of the image. This allows scholars to build up institutionally designated IIIF to provide more context or scholarly perspectives on a single image or video. Resources like Panopto can facilitate this scholarly annotating process. Although transcripts or annotations may primarily be used by scholars for their individual, internal research projects, making this additional data available and usable to the public is another method of scholarship-sharing. Whether a scholar’s annotations result in a polished, public-facing digital project or not, the creation of thickly descriptive, publicly accessible metadata still supports future scholarship and creative curiosities.

1The Cotton Club, directed by Francis Ford Coppola (Orion Pictures, 1984). 2Rudolph the Red-Nosed Reindeer, directed by Larry Roemer, produced by Rankin/Bass Productions, aired December 6, 1964 on NBC.

“Upstream Annotations” and Data Standardization: Strengthening the Foundation of IIIF Image Annotations

4 October 2026 For this week’s blog post I decided to dig into Matthew J. Westerby’s “Annotating Upstream: Digital Scholars, Art History, and the Interoperable Image” (2024). Westerby is the Digital Research Officer at the Center for Advanced Study in the Visual Arts (CASVA, National Gallery of Art, Washington D.C.). He works predominately in digital […]
« Older posts Newer posts »